Interactively drawing probabilistic graphical models
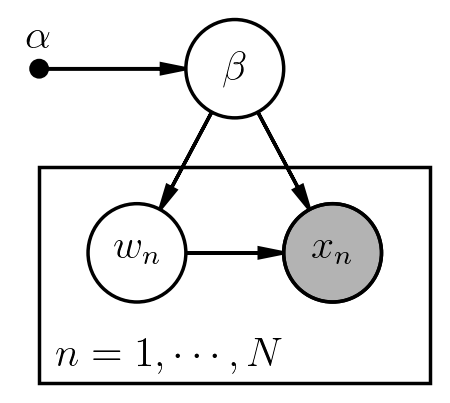
Daft is a great package for drawing probabilistic graphical models (PGM). But it assumes that you know in advance the sizes and positions of all the elements (Nodes and Plates, mostly). Since this is usually not the case, a lot of back-and-forth trial-and-error is needed to obtain a final, beautifully rendered PGM graph.

I recently added and “interactive mode” to Daft, that allows you to move the elements of a model interactively right after you have defined them and before outputting them to a figure. This is currently in a forked repository https://github.com/ixkael/daft but I have submitted a pull request to be merged with the main repository. All you have to do to activate this feature is to set a new flag in the rendering step:
pgm.render(interactive=True)
This will open a window where the Nodes and Plates can be moved. As you will see, the labels and the arrows automatically move too. However, it is not possible to resize the elements or edit their content. This requires more significant edits, and I personally find that this is not as critical as editing the layout of the graph.
So the typical Daft example will become
    pgm = ...# create model<br /> # add nodes, plates, edges, etc
    pgm.add_node(...)<br /> # render and open interactive plot
    pgm.render(interactive=True)<br /> # after you close the plot, save to file
    pgm.figure.savefig('myfigure.pdf)
There is an obvious feature missing: what if you want to keep the new layout you have just created? Just run
print(pgm) # will print Nodes and Plates (not edges).
And this will print you the exact Node and Plate statements you now need to use to create the model, with the right options and numbers for the layout you have just interactively made. You can replace those lines in your script. No need to change the edges.
